[✨Feature] Chart & Shape Export Support
- Export Excel charts directly to PowerPoint with full editing capabilities
- Export textboxes and other shapes from Excel to PowerPoint
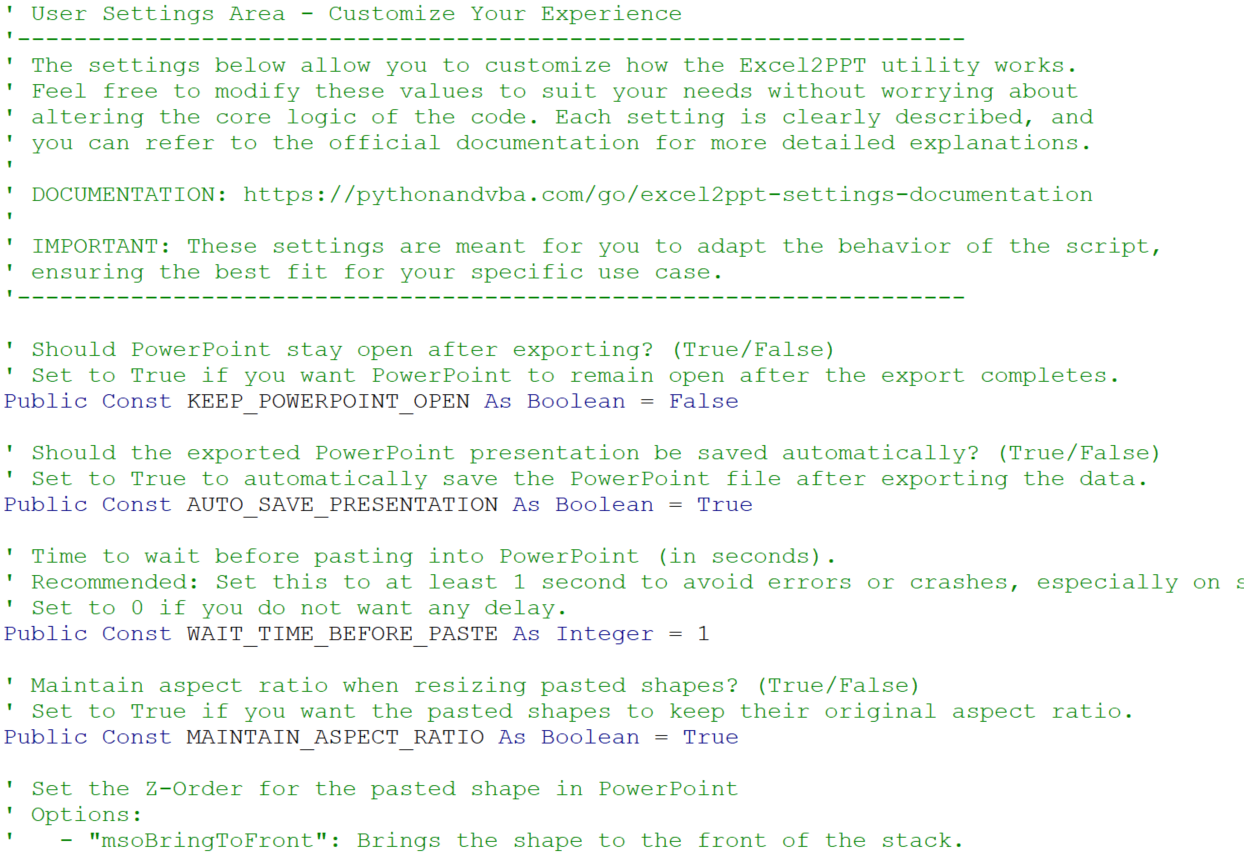
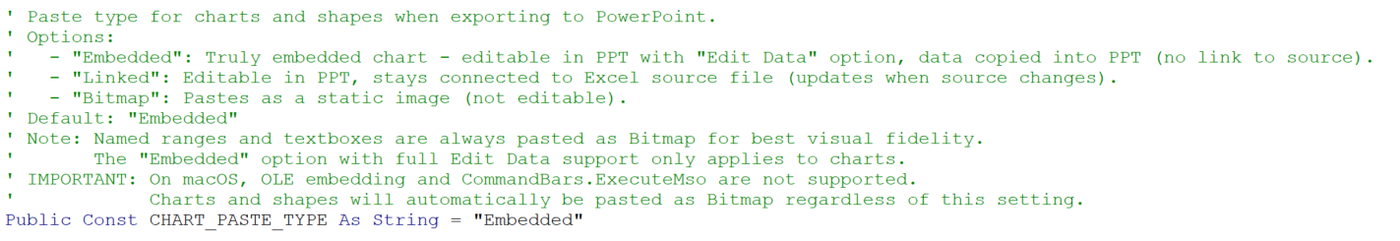
- Configurable paste type via CHART_PASTE_TYPE setting in SETTINGS module:
- "Embedded" (default): Charts are truly embedded in PowerPoint with
"Edit Data" functionality - data is copied into PPT, no link to source - "Linked": Charts stay connected to Excel source file and update when
source changes - "Bitmap": Pastes as a static image (not editable)
PLATFORM NOTES:
- macOS Limitation: OLE embedding and CommandBars.ExecuteMso are not supported
on macOS. Charts and shapes will automatically be pasted as Bitmap regardless
of the CHART_PASTE_TYPE setting.
HOW TO USE CHARTS/SHAPES:
1. In your Excel workbook, create a chart or textbox
2. Give the chart/shape a name (via Name Box or Format > Selection Pane)
3. In the tbl_Excel2PPT table, use the shape name in the "Range" column
(same as you would use a named range)
4. Run the export - charts will be embedded with Edit Data support (Windows)
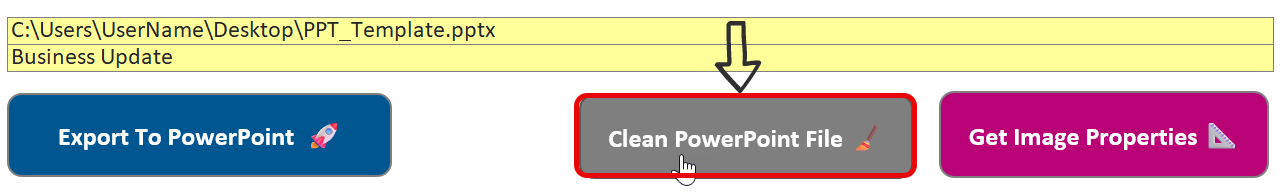
[✨Feature] Select PPT Template Button
- New "Select PPT Template" button to easily browse and select PowerPoint
template files
- Cross-platform support: Works on both Windows and macOS
- Automatically updates the pptPath cell with the selected file path